Sentinel radar satellite tracks continued Napa slip after quake
- Published

The creeping movement of the ground across California's Napa Valley following its 24 August earthquake has been observed from space.
Europe's Sentinel-1a satellite has returned beautifully sharp images of this "afterslip" process.
The information will help assess future seismic hazards in the region.
Sentinel-1a was launched earlier this year to acquire frequent and systematic radar data on the world's major tectonic hotspots.
As a consequence, researchers have been getting a snapshot of Napa every time the satellite goes overhead, every 12 days.
"What's absolutely stunning is that we see the fault continuing to slowly creep at the surface - by up to 10 cm over a couple of months," explained Prof Tim Wright from the UK's Nerc Centre for the Observation and Modelling of Earthquakes, Volcanoes and Tectonics (COMET).
"Normally, we'd miss these kinds of processes because previous European Space Agency satellites only gave us images every 35 days, and other missions don't acquire data systematically over fault zones.
"This new capability tells us about the frictional properties of the fault.
"That's what we're interested in - what actually causes some parts of faults to fail in a stick-slip fashion when other parts will gently creep past each other.
"And it seems the Napa fault can actually do both. The southern end in particular exhibits this slow afterslip."
Prof Wright is presenting the Sentinel imagery here at the American Geophysical Union Fall Meeting in San Francisco.

Sentinel observes afterslip in Napa Valley
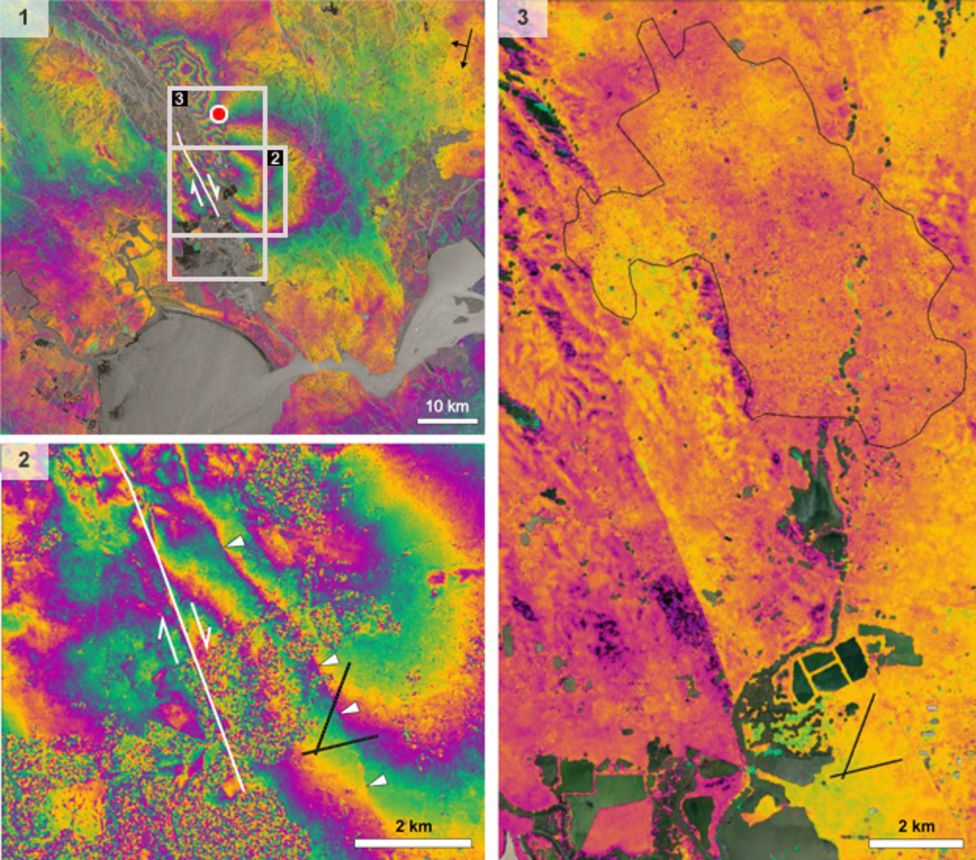
- (1) Sentinel-1a's first interferogram showing widespread ground movement in the aftermath of the August earthquake
- (2) A blow-up from the August image detailing the surface fault rupture (white line) that was mapped by scientists on foot
- (3) A sharp discontinuity is visible in this September interferogram that betrays afterslip on the fault of up to 2cm
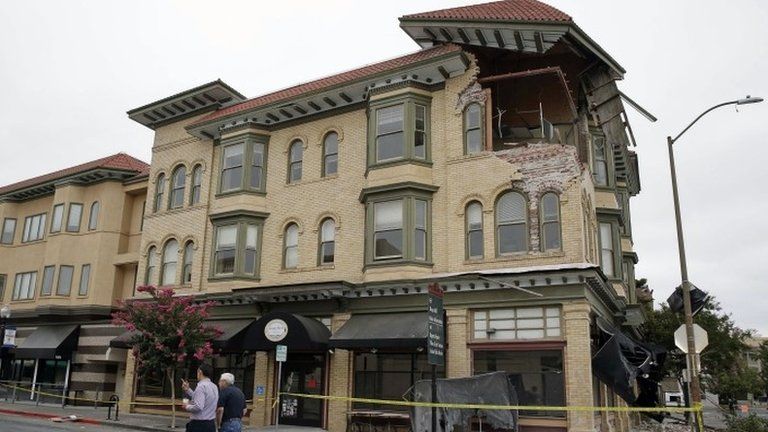
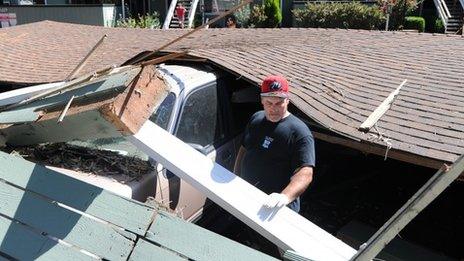
August's magnitude 6.0 tremor was the biggest quake to hit the San Francisco Bay region in 25 years.
The shaking damaged many buildings across the famous wine-growing area of Northern California, but mercifully there were few injuries and only one reported death.
It was an event that occurred just as the European Union's new Sentinel reached its operational orbit.
The satellite was sent up with one of its objectives to practice what is termed Synthetic Aperture Radar Interferometry (InSAR).
This works by finding the difference in "before" and "after" radar images of the Earth's surface taken from orbit.
It permits even quite subtle ground movements to be detected, including in those areas above a fault where the terrain itself has not been ripped apart.
The data is displayed in a special type of diagram called an interferogram.
Sentinel-1a got its baseline "before" picture of California on 7 August, and the "after" image just seven days on from the quake.
This revealed how the ground either side of the strike-slip fault had offset by tens of centimetres.
But the big advance here is that Sentinel then continued to image Napa every time it came into view.
Its unprecedented repeat pattern of 12 days has allowed scientists to trace how the strain still left in the fault zone after 24 August is gradually dissipating.

"With Sentinel, we are now in a new era for InSAR," said Prof Wright, who is based at Leeds University in the UK.
"Whereas in the past we've been able to do a few detailed studies in a few places, now we can look at all the major faults on the entire planet in this way.
"We can now look at every earthquake and try to pick out processes we've never had the chance to see before."
And the same will be true for volcanoes, landslides, and subsidence - basically, any phenomenon that involves deformation of the Earth's surface.
What is more, this capacity will be boosted in 2016 when the EU launches a sister spacecraft to Sentinel-1a.
Then, the repeat time to view the same location will be cut to just six days, meaning scientists can undertake even more rapid analyses of events.
The US Geological Survey used the AGU meeting to release a set of forecasts for the afterslip that different areas of the Napa Valley could expect in the next three years.
Consistent with the Sentinel observations, the USGS report suggests communities at the southern end of the fault rupture are likely to see the most movement in this period, up to 15cm.
"Some of the homes in this area may want to fit a stiffer foundation slab that will decouple the structure from the ground and allow for slip around the structure without moving the structure itself. This will help protect the building from being sheared through," said geotechnical engineer Julien Cohen-Waeber from the University of California, at Berkeley.

Interpreting the Sentinel interferogram below, which was produced immediately after the August quake
- The surface fault rupture, mapped in the field by scientists from the University of California, Davis, is shown by the white line
- Contours of motion are denoted by coloured "fringes" that go from blue through yellow, to red, and then back to blue
- Each contour interval shows a ground motion of 2.8cm with respect to the Sentinel-1a spacecraft in orbit above the planet
- To get the total motion, you count the fringes and then multiply by 2.8 (2.8cm is half the wavelength of the radar satellite)
- The bottom right lobe, southeast of Napa, has about three fringes, and thus a total of 10cm of motion towards the overflying Sentinel
- The fringes north of Napa also show 10cm of motion, but this time away from the satellite, as the colours cycle in the other direction
The interferograms on this page are copyrighted: Copernicus data (2014)/ESA/PPO.labs-Norut-COMET-SEOM Insarap study

Jonathan.Amos-INTERNET@bbc.co.uk and follow me on Twitter: @BBCAmos
- Published2 September 2014
- Published25 August 2014
- Published16 April 2014

- Published25 August 2014
- Published5 December 2012
- Published20 October 2008
- Published16 April 2006


